.png "Wealth Conservatory Logo (1)")
.png?width=440&height=102&name=Wealth%20Conservatory%20Logo%20(1).png)

If you want to see global economic history in a single colorful graph, keep reading. The following was produced by The Atlantic magazine and it shows the share of global GDP for various countries from the year 1 AD to 2008 AD.
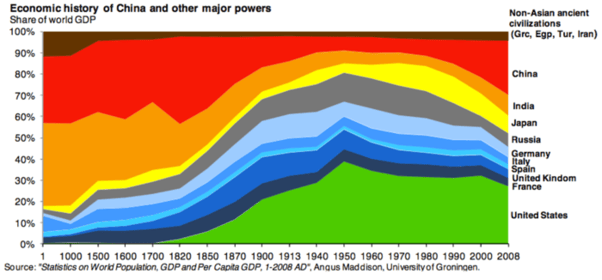
What you see in the early years might surprise you. India accounted for almost 40% of global GDP during the height of the Roman Empire, and China accounted for another 30%. Europe and the U.S. didn’t make up more than 50% of total world economic activity until the mid-1800s, and the rise of the U.S. economy is – visibly – one of the great economic stories of all time.
The shifting economic heft is not hard to explain. Before the Industrial Revolution, the size of a country’s economy was measured by the size of its population; there wasn’t a lot of leverage due to technology or innovation. When technology began expanding the productivity impact of some nations’ citizens but not others, there were significant shifts. Notice that the U.K. was basically invisible on the global economic landscape until the late 1600s, and became significant as the steam engine and manufacturing technology were born in its cities.
When this blog was first written in 2015, the U.S. made up approximately 5% of the global population and generated 21% of its GDP. In 2021, the population stat dropped to 4.25% and the GDP to 15.74%. The U.S. is now number two on the list of countries with the largest proportion of GDP based on Purchasing Power Parity (PPP), under China. Their population is equivalent to 18.47% of the world as a whole and they generated 18.62% of its GDP in 2021. These statistics show technological leverage working in favor of China while the U.S.’ share of the world’s economy is slowly eroding.
This helps to put into perspective why it is important for most diversified portfolios to be invested abroad. The pendulum swings at an unpredictable and uneven pace, but it never stands still and it never keeps going in the same direction. The only surefire way to be on both receiving ends is to be on both ends at the same time.
Sources:

