.png "Wealth Conservatory Logo (1)")
.png?width=440&height=102&name=Wealth%20Conservatory%20Logo%20(1).png)
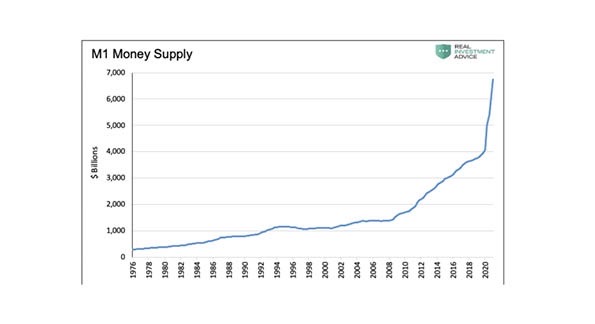
Conventional economics tells us something that would seem to be obvious: when the government creates more money, there is more money available to buy things, and therefore the prices of things rise—and we get inflation. For some reason, this logical sequence of events seems not to be happening today. The amount of money in the U.S. economy is 25% higher than it was at the start of 2020—the fastest pace of growth since the U.S. Federal Reserve banking system was established in 1913. You can see from the chart that we have experienced steady growth of the money supply until around 2009, when the slope increased (remember the Great Recession?), and then in early 2020 the growth of dollars in the system made another dramatic shift upwards.
![Growth in money supply[1]](https://blog.wealthconservatory.com/hs-fs/hubfs/Growth%20in%20money%20supply%5B1%5D.jpeg?width=595&name=Growth%20in%20money%20supply%5B1%5D.jpeg)
Yet the published inflation rate, as measured by the Consumer Price Index, was up just 0.4% in December. Also, we finished calendar 2020 with the CPI up 1.4%-1.6%. Inflation, despite the flood of new dollars, appears to be extremely tame.
But is it really? There is evidence that the inflation effect is, at least temporarily, being squeezed into a few sectors that are not accounted for in the CPI. One of them is the cost of buying a house. U.S. housing prices, in aggregate, rose 8.4% last year, and median listing prices for houses on the market were up 14.4%—two numbers which would be considered highly-inflationary. Also, if we are looking for the pain caused by inflation, then you can point to the housing affordability crisis that is emerging in 2021.
An even more dramatic example of inflation is a place where most people tend not to look for it: in the investment markets. A recent article took an unusually perceptive look at the impact of record stock prices and historically low bond rates. Noting that high stock prices reduce the value of dividends proportionately, and low bond rates make interest income more expensive, the authors looked at how much it would cost to “buy” $1,000 a year of income in the investment markets. Historically, if you invested $25,000 in a 50/50 stock/bond portfolio, that portfolio would generate $1,000 a year of income. That figure is roughly $80,000 today—and you can see from the chart that we are way, way above historical norms since 1870.
The rise in housing prices, stocks, and bonds suggests that the influx of dollars is being felt in the economy. However, the CPI is not being impacted. This is not conventional, but that is true of many things that have happened since spring of 2020.

